Which Microbial Diversity Metrics Actually Matter?
Imagine you’re baking a cake. You have all the ingredients, but how do you know you have the perfect mix?
In the world of microbes, it’s similar. Scientists use different measurements to figure out the variety of microorganisms in a place, like your gut or the soil.
But which of these measurements, or metrics, truly give us the best picture of what’s going on? This post will help you explore the microbial diversity world and discover which metrics are the most important.
You’ll also get a better idea of how these metrics affect everything from your health to the environment.
This means you will learn to better analyze the data, making it easier to appreciate and interpret the data about microbial populations.
Key Takeaways
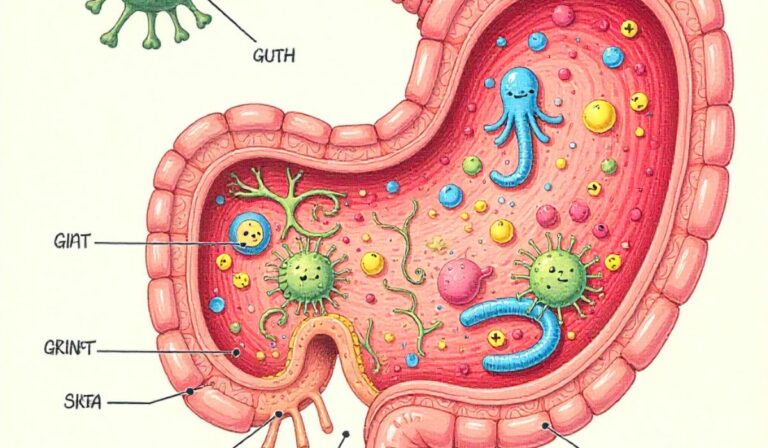
![Which Microbial Diversity Metrics Actually Matter[1]](https://mycleanseplan.com/wp-content/uploads/2025/10/Which_Microbial_Diversity_Metrics_Actually_Matter1.jpg)
Uncovering the Essentials of Microbial Diversity Metrics
Microbial communities are incredibly diverse. These tiny organisms, like bacteria and fungi, live everywhere – in your body, in the soil, and in the oceans.
Scientists have developed a whole set of tools to explore these populations, and these tools depend on particular microbial diversity metrics to examine and compare them.
But not all metrics are equal, and some are more useful than others depending on what you’re trying to find out. This section explores several different metrics and how they are used.
Richness: Counting the Microbial Cast
Richness is one of the simplest and most fundamental metrics. It simply counts the number of different types of microbes (also known as species or operational taxonomic units, OTUs) present in a sample.
It gives you a basic idea of how many different kinds of microbes are in a given environment. A higher richness value means more different types of microbes are present.
While straightforward, it’s important to remember that richness alone doesn’t tell the whole story.
Imagine a forest with many different tree species versus one with just a few; the one with more species is richer, but the number of each type of tree is not considered.
- Richness provides a simple count of microbial groups.
- High richness means more different types of microbes exist.
- It’s a base measure, but needs other metrics for a complete view.
- Simple to compute, making it a good first step.
- Doesn’t consider the amount of each microbe.
For example, researchers exploring soil samples may use richness to see how many different types of bacteria are present in an area.
If a soil sample from a healthy field shows a high richness value, while a sample from a field impacted by pollution shows a lower value, it suggests that the pollution may be hurting the microbial community. However, richness alone does not identify the abundance or overall diversity.
Evenness: A Balanced Microbial Community
Evenness measures how evenly the microbes are distributed within a community. It looks at the proportion of each type of microbe in a sample.
High evenness means that the different types of microbes are present in similar amounts. Low evenness shows that a few microbes are dominant, while others are rare.
Evenness is vital to consider alongside richness, as a community with high richness and low evenness might be less stable than one with slightly lower richness but higher evenness, meaning the microbes are more evenly distributed.
- Evenness shows how evenly microbes are distributed.
- High evenness signifies an equal distribution.
- Low evenness implies a few dominant microbes.
- Helps judge the stability of a community.
- Often considered with richness for a full assessment.
Consider the difference between a rainforest and a wheat field. The rainforest might have high richness, with lots of different plant species, but also have different levels of evenness. If one species dominates, evenness will be low.
The wheat field might have low richness, but high evenness, since only one species is grown in a regular pattern.
To measure evenness, different indexes are used, such as the Pielou’s J’ or Shannon’s diversity index, which consider how even the species are distributed and weigh the relative abundance of each one. These are used to calculate an evenness score, revealing the balance.
Diversity Indices: Blending Richness and Evenness
Diversity indices are single values that take into account both richness and evenness. These indices give a more complete view of microbial diversity than just considering richness or evenness alone.
They are calculated using different formulas that consider both the number of different types of microbes and how abundant each type is.
There are many diversity indices, such as the Shannon index and the Simpson index, each with its own focus.
- Diversity indices combine richness and evenness.
- They provide a single, comprehensive value.
- Shannon index is common, sensitive to rare microbes.
- Simpson index weighs more abundant microbes.
- These indices help in comparing different communities.
The Shannon index is sensitive to rare microbes, making it valuable for exploring the full range of a community. The Simpson index is less sensitive to rare species, emphasizing the dominant ones.
These indices can identify changes in microbial populations due to environmental changes. A decrease in a diversity index, for example, could indicate that pollution or another stressor is reducing the health of a community.
Choosing the Right Metrics for Your Research
The choice of which microbial diversity metrics to use depends on the research question. The goal should be to investigate questions such as ‘what is driving the diversity?’
or ‘how do communities compare?’ Are you trying to find out how many different types of microbes are present, or do you want to explore how the microbes are distributed? The specific methods you choose are essential, and a mix of tools often offers the best insight.
Defining Your Research Questions
Before you begin, clearly define what you want to learn. Are you interested in the total number of microbes (richness), how balanced the community is (evenness), or a combination of both (diversity indices)?
Different questions need different metrics. For example, if you want to find out how a change in diet affects the diversity of gut bacteria, you might start with both richness and evenness to get a broad view.
- Clearly define your research objectives.
- Different questions need different metrics.
- Example: Gut bacteria and diet changes.
- Start with a broad assessment of richness and evenness.
- Consider environmental factors that influence results.
For example, if you are exploring the effects of fertilizer on soil microbes, you might initially measure richness to see if the fertilizer increases the number of different types of microbes.
Then, you could examine evenness to see if the fertilizer causes some microbes to become dominant, changing the balance of the community. Understanding your goal will help you choose the most useful methods.
Accounting for Sample Type and Size
The type and size of your sample can affect your choice of metrics. For instance, a small sample might not have enough microbes to represent the full diversity of a large environment.
The method of collection also matters. Different sampling methods may favor some microbes over others.
It is critical to take these considerations into account when selecting your methods. Standardized protocols and large sample sizes can help reduce bias and improve the reliability of your study results.
- Sample type impacts your metric selection.
- Small samples might not capture full diversity.
- Collection methods can introduce bias.
- Standardized methods are very important.
- Larger sample sizes increase reliability.
Consider the difference between a soil sample and a water sample. A soil sample might be more complex, with a greater variety of microbes, and therefore require a larger sample size to represent the diversity.
In contrast, a water sample might have fewer microbes, depending on the environment, and a smaller sample size might be sufficient to give a good picture.
The size and type of the sample will change how you analyze the microbes, as well as the types of measurements that are relevant.
Statistical Analysis: Data Interpretation
Once you’ve collected the data and calculated your metrics, statistical analysis helps you interpret your findings.
This can involve comparing the metrics across different samples or looking for relationships between the metrics and other variables, like environmental conditions.
Statistical tests can determine whether the differences you see are significant or are simply due to random chance.
- Statistical tests help make sense of the data.
- Compare the metrics across different samples.
- Find relationships between metrics and other variables.
- Tests reveal whether differences are significant.
- Use statistical tests to enhance data interpretation.
For example, you might use a t-test to compare the Shannon diversity index between two different soil samples.
If the test shows a significant difference, you can conclude that the microbial diversity is significantly different between the two samples.
The selection of statistical tests depends on the type of data and the research question. This will provide a more detailed and accurate analysis of the data.
Real-World Examples and Practical Applications
The study of microbial diversity and its metrics is crucial across various sectors. These metrics help researchers and scientists explore the natural world around us. Here are some examples of how these metrics are employed, and why they matter.
Health: Gut Microbiome Research
In human health, understanding the diversity of the gut microbiome is very important. The gut microbiome is a complex ecosystem of microbes that affects everything from digestion to mental health.
Metrics like the Shannon diversity index are often used to assess the overall diversity of gut bacteria.
Lower diversity is often linked to various health problems, such as inflammatory bowel disease and obesity, while higher diversity is seen as a sign of a healthier gut.
- Gut microbiome is vital for health.
- Shannon index measures gut diversity.
- Lower diversity relates to health issues.
- Higher diversity indicates a healthier gut.
- Diversity metrics guide personalized medicine.
For example, researchers might compare the diversity of gut bacteria in people with and without a specific disease.
The results help to identify any differences in the makeup of the gut microbiome. This information can then be used to develop treatments or suggest changes in diet to enhance gut health.
Agriculture: Soil Health and Crop Production
In agriculture, soil microbial diversity plays a major role in the health of the soil and the production of crops.
Healthy soil with diverse microbial communities is more able to cycle nutrients, suppress diseases, and support plant growth.
Metrics such as richness and evenness are used to explore soil diversity in farming practices. For example, comparing the microbial communities in soils that use different fertilizers or farming methods.
- Soil microbes support plant growth.
- Metrics assess soil diversity in farming.
- Compare the effects of fertilizers.
- Healthy soil improves crop yields.
- Sustainable practices can enhance diversity.
Consider a case study comparing organic farming with conventional farming. The results showed that organic farming had soils with higher richness and evenness, resulting in better soil health and crop yields.
This knowledge helps promote sustainable farming practices, which improve soil health and enhance crop production.
Environmental Science: Ecosystem Monitoring
Environmental scientists use microbial diversity metrics to assess the health of ecosystems. Changes in the diversity of microbes can signal environmental problems, such as pollution or climate change.
Scientists will measure changes in microbial communities in different environments, such as waterways and forests.
These metrics provide early warnings of environmental damage. A sudden decrease in diversity could indicate pollution, which helps to take action to protect the environment.
- Microbes signal environmental issues.
- Metrics alert environmental damage.
- Monitor changes in waterways and forests.
- Decreases in diversity signal pollution.
- Data helps set conservation priorities.
For instance, researchers studying a river might collect samples and analyze the microbial diversity over time. A decline in diversity might correlate with increased levels of pollutants.
This information can then be used to pinpoint the source of pollution and take steps to protect the river and its ecosystem. This helps create solutions to preserve the environment.
Tools and Techniques for Measuring Microbial Diversity
Measuring microbial diversity involves several advanced tools and methods, from DNA sequencing to bioinformatic analysis.
Understanding these tools and the methods used to calculate and interpret the data is crucial. This section explores these technologies and gives a better understanding of how scientists can assess microbial diversity in samples.
DNA Sequencing Technologies
DNA sequencing is one of the most critical techniques used to study microbial communities. Technologies like next-generation sequencing (NGS) have revolutionized the field, allowing scientists to rapidly sequence thousands of microbial genomes at once.
This gives detailed information on the types and amounts of microbes present in a sample. Common methods are 16S rRNA gene sequencing, which targets a conserved region of the bacterial genome, and shotgun metagenomics, which sequences all the DNA from a sample.
- DNA sequencing is essential.
- Next-generation sequencing is important.
- 16S rRNA gene sequencing identifies bacteria.
- Shotgun metagenomics sequences all DNA.
- Technologies reveal microbial profiles.
Consider a sample of soil. Using NGS, scientists can sequence the 16S rRNA gene from the bacteria present in that sample.
This allows them to identify each type of bacteria and determine its abundance. Shotgun metagenomics offers a much more detailed view by sequencing all the DNA, including functional genes.
This method allows you to explore what the microbes are doing, such as breaking down pollutants or creating nutrients.
Bioinformatic Analysis: Data Processing
Once you have sequenced the DNA, bioinformatic analysis is the following essential step. This involves using specialized computer programs and algorithms to process and interpret the vast amounts of data produced by sequencing.
This can include quality control, removing errors in the data, grouping similar sequences into OTUs, and calculating diversity metrics, like richness and the Shannon index.
The right bioinformatic tools turn raw data into meaningful results that tell us about the microbial community.
- Bioinformatics is key to processing data.
- Uses programs to analyze sequencing results.
- Quality control removes errors in data.
- Group sequences into OTUs.
- Calculates diversity metrics, providing insights.
Consider the process of aligning sequences to a database. The bioinformatics pipeline might start by filtering the raw sequence data to ensure high quality, eliminating incorrect readings.
After that, it aligns the filtered sequences to a database of known microbial genes. This is followed by grouping related sequences into OTUs to estimate the species present.
Finally, the analysis produces various diversity metrics. This lets you determine what the diversity is within the community.
Statistical Software and Visualization Tools
Statistical software and visualization tools are important for displaying and interpreting the results of microbial diversity analyses.
Software packages like R and specialized tools help calculate diversity metrics and perform statistical tests.
These tools also allow you to create graphs and charts to visualize your findings, making it simpler to share and understand them. The visualization tools help you visualize the data to show trends or differences in communities.
- Statistical software is key for results.
- Software helps perform statistical tests.
- R and other tools calculate metrics.
- Create graphs and charts.
- Visualization simplifies complex data.
Imagine comparing the Shannon diversity index from multiple samples. You can use R to calculate the values and test for significant differences.
The visualization features of R help you to show the results in a bar graph. This visual representation can easily demonstrate the differences and make it easier to interpret them. A graph will make it much more accessible than viewing only raw numbers.
FAQ Of Which Microbial Diversity Metrics Actually Matter?
How are richness and evenness different?
u003cstrongu003eA:u003c/strongu003e Richness is a simple count of the total number of microbial types in a sample, while evenness measures how evenly the microbes are distributed among these types. Richness focuses on quantity, while evenness considers the balance.
What does the Shannon index tell us?
u003cstrongu003eA:u003c/strongu003e The Shannon index is a measure that combines richness and evenness into a single value. It reflects both the number of different microbial types and how balanced the population is. A higher value indicates greater diversity.
Why are diversity metrics important in health?
u003cstrongu003eA:u003c/strongu003e In health, diversity metrics like the Shannon index help assess the gut microbiome. A high diversity of microbes is generally linked to better health, while low diversity can correlate with various diseases.
How do scientists measure microbial diversity?
u003cstrongu003eA:u003c/strongu003e Scientists use advanced methods like DNA sequencing (NGS), often targeting the 16S rRNA gene, followed by bioinformatic analysis. Then, they use statistical software to compute diversity metrics and generate visualizations.
What are some of the limitations of using diversity metrics?
u003cstrongu003eA:u003c/strongu003e Metrics like richness can overlook rare microbes, which are also vital. These metrics don’t always explain which microbes are performing specific functions. Also, the choice of metric and sampling method can influence the results.
Final Thoughts
Finding out what metrics matter for measuring microbial diversity involves understanding the different tools and how to apply them.
Richness gives a simple count, evenness shows balance, and diversity indices combine these for a broader view.
Choosing the right metrics depends on the research goals and type of sample. In real-world applications, these metrics are key for health, agriculture, and environmental science.
From DNA sequencing to data analysis, this knowledge provides the ability to examine and interpret the makeup and function of microbial communities. Remember that the correct choice of methods and analyses will lead to greater success.
![10 Causes of Morning Stomach Discomfort Why You Feel Awful[1]](https://mycleanseplan.com/wp-content/uploads/2025/11/10_Causes_of_Morning_Stomach_Discomfort__Why_You_Feel_Awful1-768x448.jpg)

![Seaweeds, Algae & Gut Microbes Nourishing Your Body Naturally[1]](https://mycleanseplan.com/wp-content/uploads/2025/10/Seaweeds_Algae__Gut_Microbes__Nourishing_Your_Body_Naturally1-768x448.jpg)
![Gut Health in Ancient Diets Exploring the Past for the Future[1]](https://mycleanseplan.com/wp-content/uploads/2025/11/Gut_Health_in_Ancient_Diets__Exploring_the_Past_for_the_Future1-768x448.jpg)
